
Audiences Uncovered: Asian American Pacific Islanders

Hello J3! As a reminder, we are now LIVE on Substack, where you can find all of the past and future editions of our monthly newsletter there.
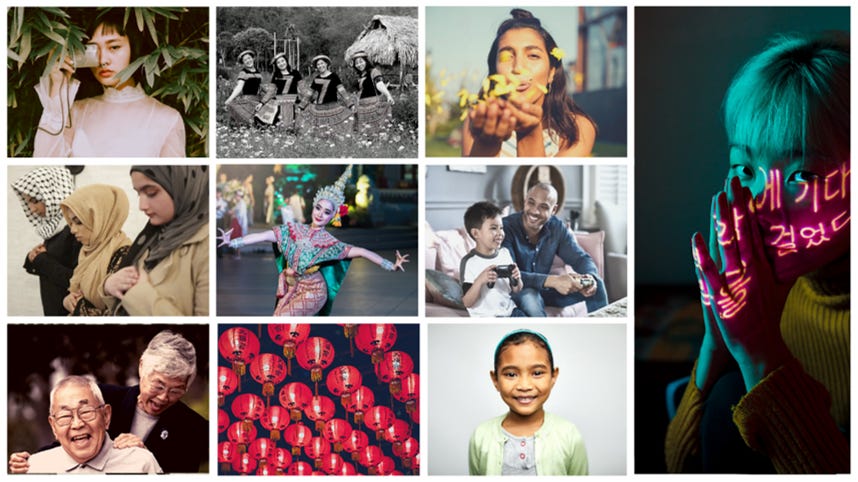
May is many things…the apex of allergy season, a prelude to summer, but perhaps most importantly the month where we celebrate many deserving audiences — including nurses, mothers, and Asian American Pacific Islanders**. This edition of Audiences Uncovered is dedicated to Asian Americans, the fastest growing racial group in America, in celebration of Asian Pacific American Heritage Month (APAHM). This audience is growing so fast and spending so much that they can’t be ignored. Although they’re beginning to receive a fairer share of the cultural spotlight, this group is still largely understudied and misunderstood – especially by brands. We’ve titled this series “Audiences Uncovered” because as your dedicated Audience Engine team, we have a mission to understand our high value audiences, decoding their needs and motivations into actionable insights.
(**NOTE: the terms Asian Americans, Asian American Pacific Islanders and AAPIs will be used interchangeably referring to people descending from the Asian continent or islands in the Pacific islands of Melanesia, Micronesia and Polynesia)
This newsletter is 1,580 words, approximately a 6 minute read.
By the numbers
(May) 1843: US saw the arrival of the first Japanese immigrants, one of the reasons why May was chosen as Asian Pacific American Heritage Month (APAICS)
(May) 1869: Transcontinental railroad was completed; the majority of its ~2,000 miles of track were primarily laid by Chinese immigrants (History), another reason why May was chosen as Asian Pacific American Heritage Month (APAICS)
66: Percent of time spent on digital devices (vs. 33% on live TV), the highest ratio among all consumer segments (Nielsen)
43: Median age of Asian Americans, compared to 48 for the total pop (2020 MiM)
72: Percent increase in the Asian American population from 2000-2015, the fastest growth rate of any major ethnic group (Pew)
791: Index of AAPIs living in Hawaii (i.e. they are almost 8x more likely to live in Hawaii than in any other state), making Hawaii the state with the highest percentage of Asian American residents. The next state? California with an index of 259. (US Census)
76: Percent of Asian Americans who think Asian culture has influenced American food (2020 MiM) — your DoorDash history would agree
$1.3 Trillion: Projected purchasing power of Asian Americans by 2022 (Nielsen)
1-in-2: Asian Americans believe businesses should make more of an effort to address issues involving AAPI communities (2020 MiM)
Under-represented and over-simplified
Asian ≠ Chinese
Too often Asian American subgroups are conflated, with the most prevailing image being that of Chinese Americans. Though Chinese Americans do account for nearly a quarter of all Asian American groups (23%), Asian Americans originate from many different regions (East Asia, South Asia, Southeast Asia, West Asia, North Asia to name a few), speaking a multitude of languages (including English — hello!) , and practicing many different faiths.
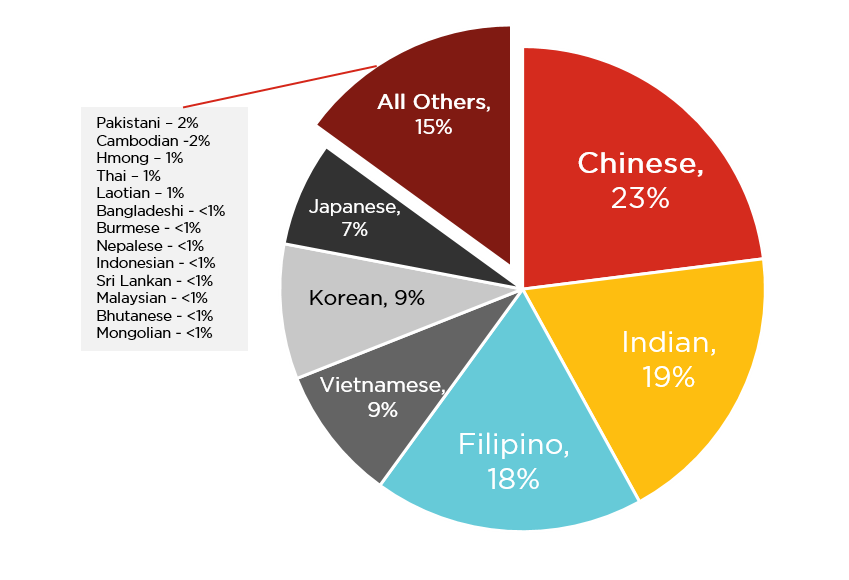
Source: Pew Research, “Key facts about Asian origin groups in the US”
Asian ≠ “Crazy Rich”
While it is true that AAPIs have the highest average HHIs of any racial/ethnic group ($73K, compared with $53.6K for the total pop), they also have the most income disparity. According to Pew Research, Asian Americans in the top 10% of income earned 10.7x more than the bottom 10%.

The 90/10 ratio is commonly used by researchers and government agencies as a measure of inequality. It takes the ratio of the income needed to place among the top 10% of earners in the U.S. (the 90th percentile) to the income at the threshold of the bottom 10% of earners (the 10th percentile). Per the chart above, the 90/10 ratio varies widely by race and ethnicity. In 2016, Asians at the 90th percentile of their income distribution had 10.7 times the income of Asians at the 10th percentile. The 90/10 ratio among Asians was notably greater than the ratio among blacks (9.8), whites (7.8) and Hispanics (7.8).
Researchers attribute this economic inequality to the diversity in AAPI origins and experiences, as well as the disparity in education levels which vary widely among Asians living in the U.S. In 2015, the share with at least a bachelor’s degree, among adults ages 25 and older, ranged from 72% among Indians to 9% among Bhutanese. Similarly, median HHI varied from $100,000 among Indians to $36,000 among Burmese, and poverty rates ranged as high as 35% among the Burmese and 33% among the Bhutanese.

Source: Pew Research, “Key facts about Asian origin groups in the US”. Note: Bhutanese, Malaysian, and Mongolian estimates not shown due to small sample size.
Although the industrious “model minority” myth is considered by some to be a positive stereotype (here’s why it’s not), it is a stereotype nonetheless, downplaying the racism many Asian Americans experience, pitting them against other racial groups, and making many Asian Americans who do not fit in with the stereotype feel erased. In marketing to Asian Americans, brands need to avoid flat, one-note portrayals in order to make this audience feel seen and valued, not diminished.
Perpetual foreigner
Just like the myth of the model minority, Asian Americans have also had to contend with being characterized by their other-ness, as a perpetual foreigner. This harmful stereotype assumes a more homogeneous American culture, excluding many AAPIs and any other racial/ethnic/religious groups who do not fit the expectations of what Americans should be. Not only is this cultural exclusion inaccurate, it is dangerous, making AAPIs more susceptible to xenophobic attacks and racial scapegoating.
#WashTheHate
This has been especially true recently as a result of COVID-19. #WashTheHate was a campaign started by IW Group (an IPG agency) with the goal of promoting solidarity and bringing awareness to the discrimination many Asian Americans were facing in the wake of the pandemic.
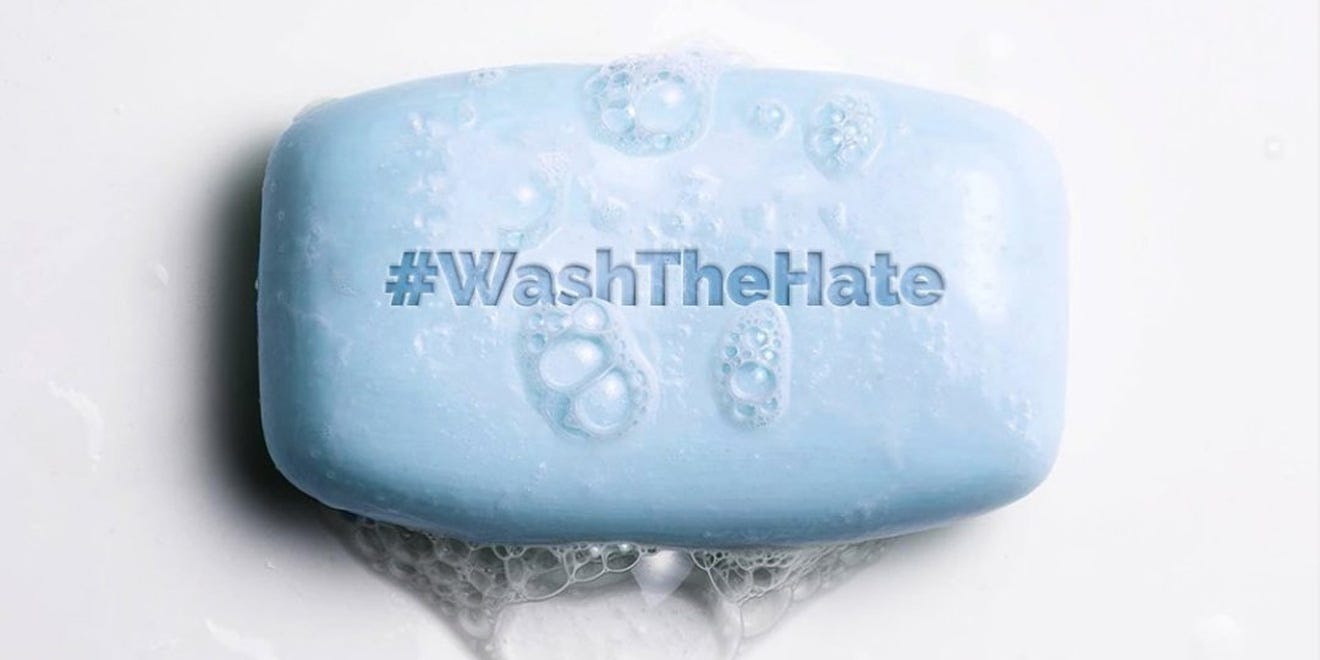
The campaign launched on 3/19, one day after Donald Trump referred to the coronavirus as the “Chinese virus” for the first time. Participants were asked to post a video of themselves washing their hands for 20 seconds and while washing to share a story of how COVID-19 has affected their lives.
Two months later, the campaign has gotten the participation of brands and celebrities, garnered over 100MM social media impressions, and been mentioned in over 150 outlets — including People, Today Show, and Good Morning America.
“It’s an honor just to be Asian”

Like many other multicultural groups, the assimilationist strategies of Gen X have given way to Gen Y’s culture of radical self-love and acceptance. Whereas older generations may have viewed blending in and conforming as a necessary step for social acceptance, younger generations are more comfortable standing out, celebrating what makes them unique. 58.6% of Asian Americans 18-34 agree that they “celebrate being Asian all of the time”, compared with 45.0% of Asian Americans 35-54, an index of 122 vs. 97.
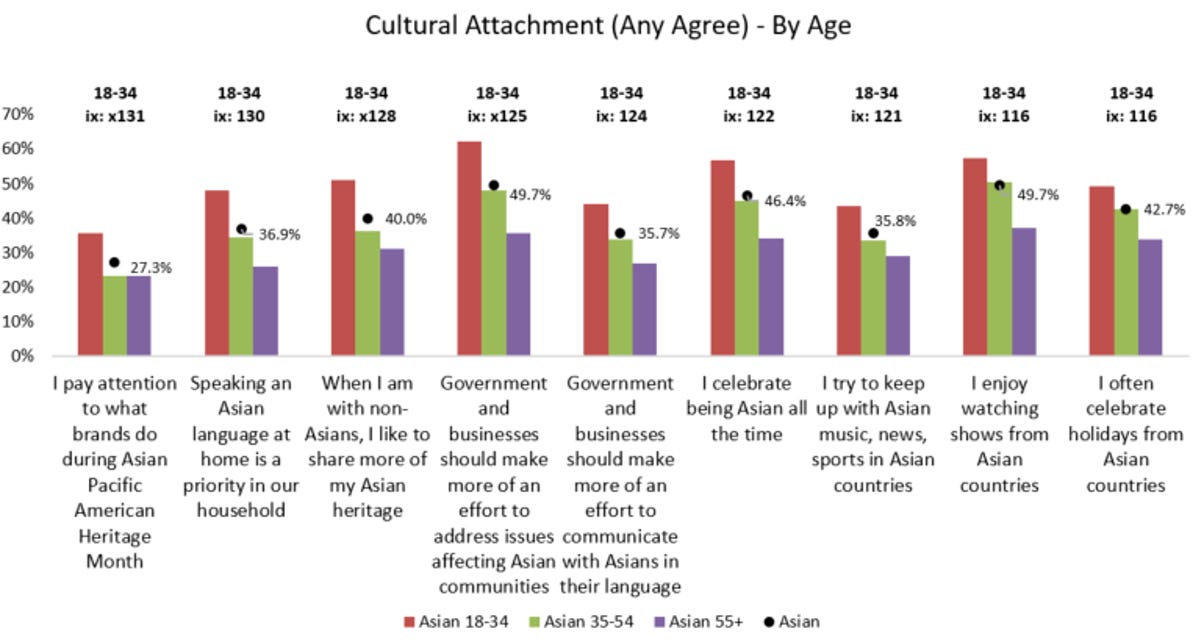
Source: 2020 MiM
Cultural values
Recently ThinkNow Research did an extensive study on AAPI cultural values. While the main takeaway is that Asian Americans are a heterogeneous mixture of many different cultures, nationalities, and faith systems, there are some key themes and patterns that emerge — Asian Americans collectively agree that ‘Family’ comes first in the hierarchy of cultural values. Also of note, ‘Financial Success’ shows the highest index among Asian-Americans than for any other racial/ethnic group.
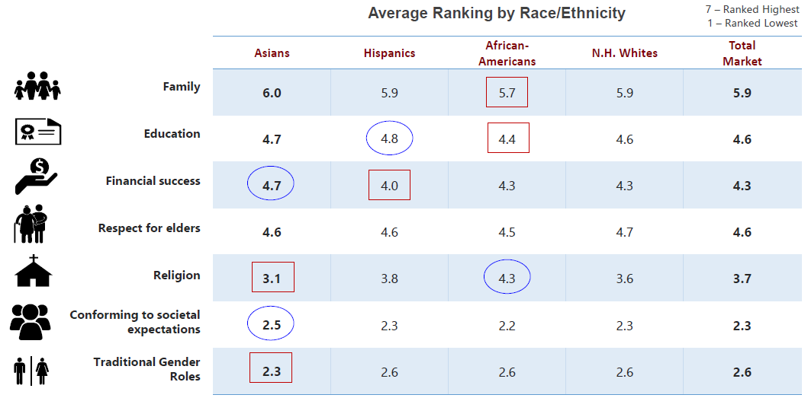
The numbers represent the average ranking in importance with 7 as the highest and 1 as the lowest. Numbers circled in blue show where each racial/ethnic group ranks highest relative to other races/ethnicities. Numbers with a red box indicate where each racial/ethnic group ranks lowest relative to other races/ethnicities.
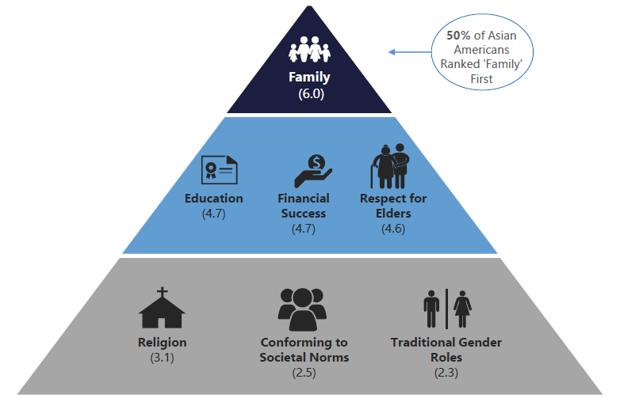
Family, education, financial success, and respect for elders are named as the most important for Asian Americans.
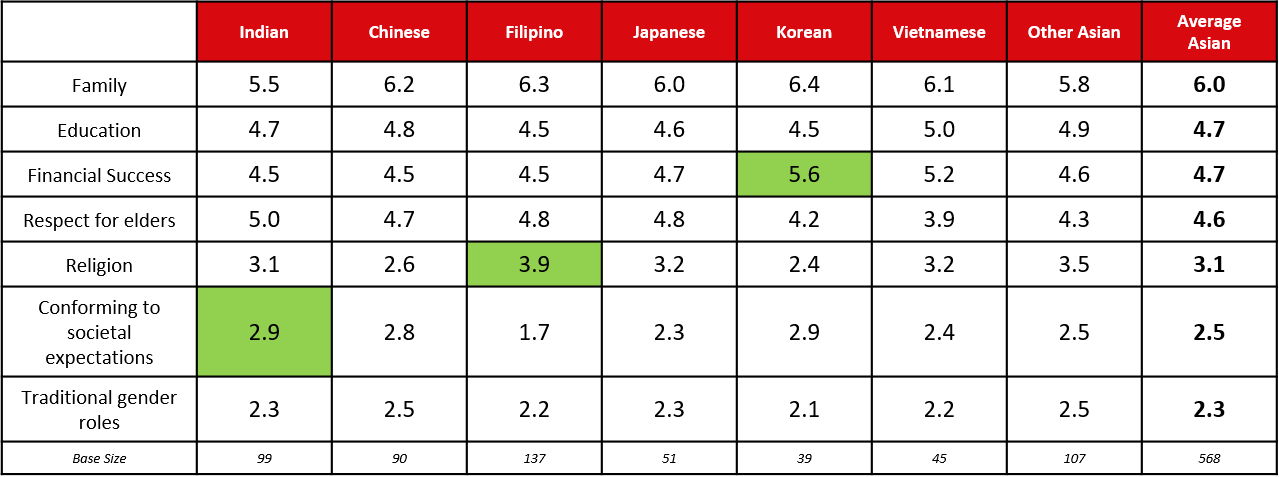
However, there are differences. Asian American values, inevitably shaped by their unique backgrounds and life experiences, show nuances corresponding to country of origin. All Asian groups place the highest value on family, but Indians over-index on “conforming to societal expectations”, Koreans place more emphasis on “financial success” and Filipinos on “religion”.
Media habits
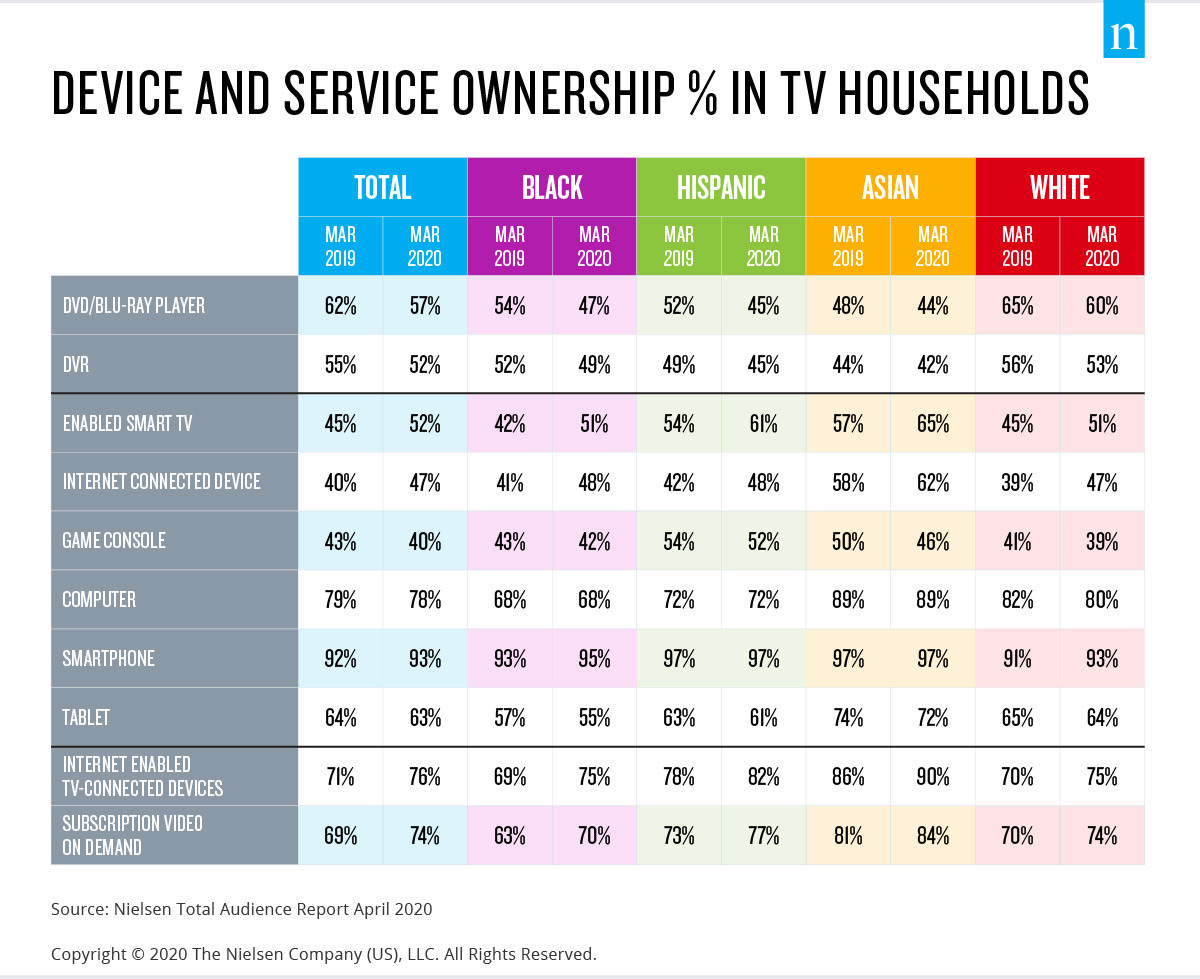
Historically, Asian Americans have led the way with digital and new technology adoption. According to Nielsen’s most recent Total Audience Report, 90% of all Asian American HHs own internet-connected TV devices, compared with 76% of the total U.S. population. Within Asian American HHs, subscription video on-demand (SVOD) penetration is nearly universal with 84% subscribing to at least one streaming service, 10% pts higher than the total population. As early adopters across most digital platforms, Asian American consumers make attractive audiences for those tech savvy brands who make the effort to target them in the digital environments where they are.
And because Asian American households are often multi-generational, they’re the most likely to engage in co-viewing with another person in the household, making buys targeted towards them even more efficient.

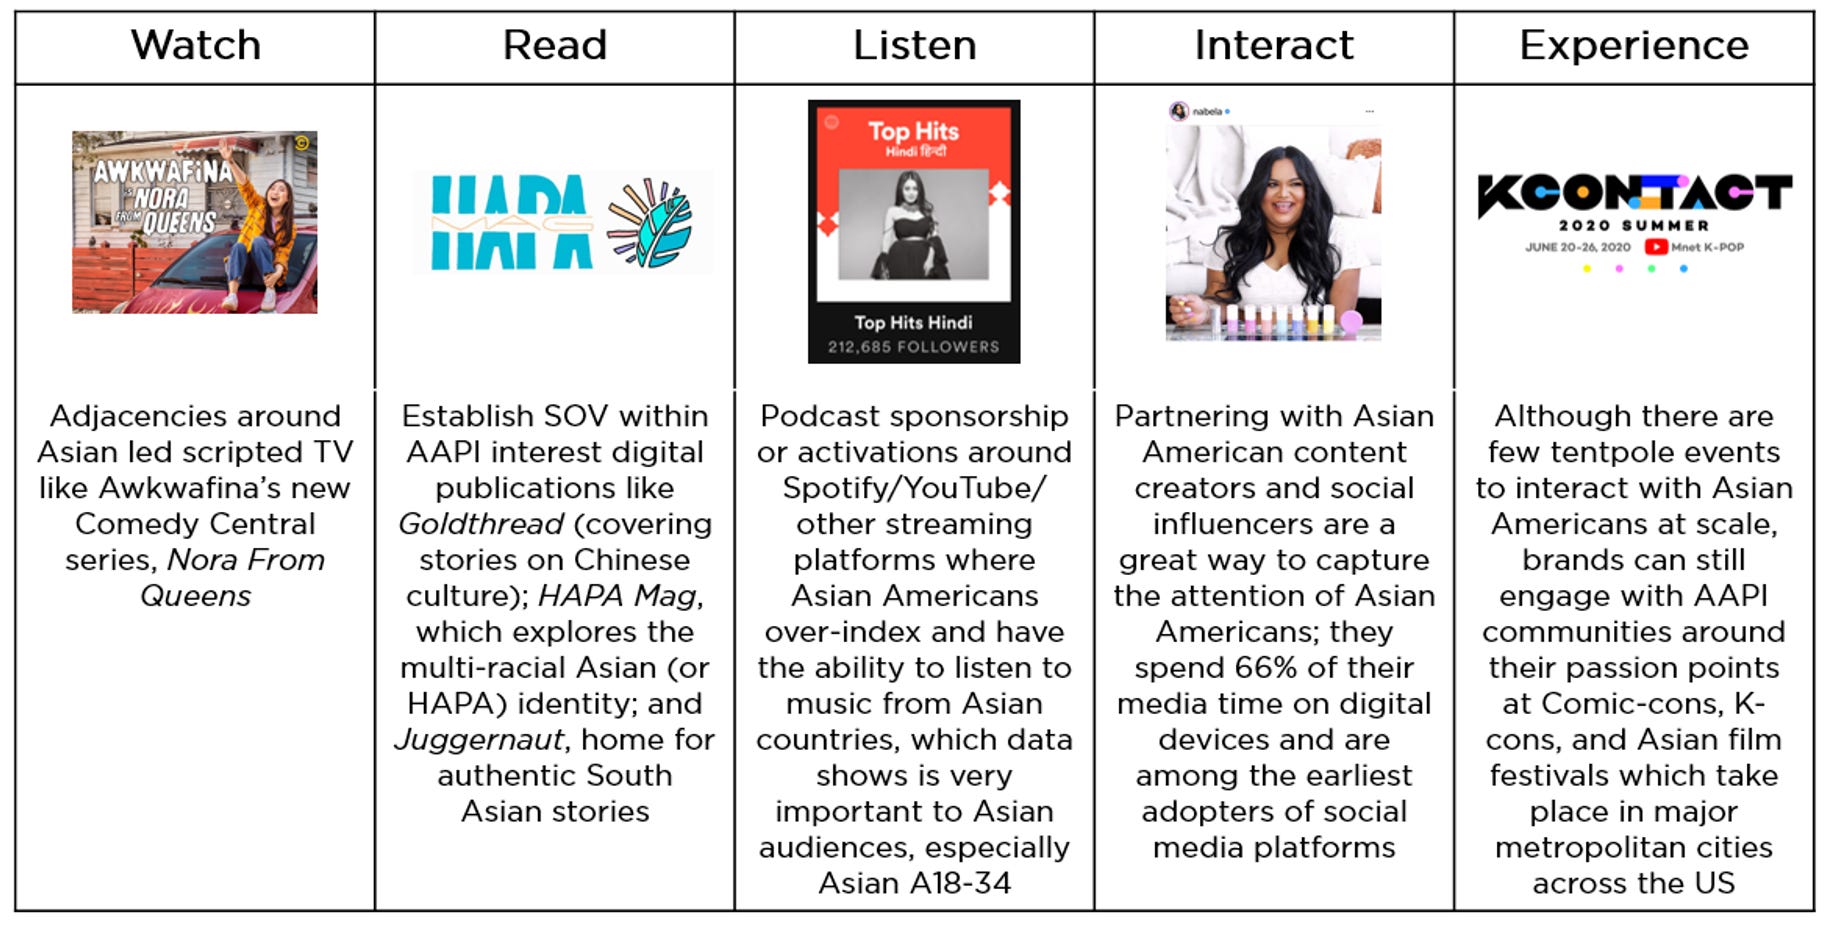
Despite voracious appetites for digital touchpoints, AAPIs aren’t just consuming media. Many are active content creators and established influencers (including makeup guru and transgender activist Nikita Dragun, beauty educator Tamanna Roashan, and body-positivity influencer Nabela Noor) and marketers should consider partnering with them to create content that builds trust and resonates with the Asian American market. Historical portrayals of Asian Americans in media have been from a non-Asian purview, steeped in stereotypes, xenophobia, and racism, but with the advent of social media and blogging, Asian Americans have had more opportunities to shape their own narratives. Asian Americans have taken the spotlight in an array of roles and programming that highlight their unique POV and heritage, offering Asian American artists the creative freedom to define themselves and tell their stories, independent of Hollywood’s traditional gatekeepers.

Today, streaming platforms offer a new stage for Asian American voices, with many Asian American creators taking roles both in front of and behind the camera, ushering in a new generation of Asian Americans in media. As Nielsen phrased it, “these authentic voices have helped galvanized the Asian American community; instead of wondering what the future holds, brands can shape that future alongside [them].” That future is now.
Additional connection points for marketers
Source: Nielsen, Engaging Asian consumers at the dawn of a new decade
A (permanent) seat at the table

Many AAPIs recognize their influence on American consumer culture, but don’t see it discussed by the brands they buy. 43.8% of surveyed Asian Americans thought that Asians have an impact on American beauty, but less than 1% of them report seeing beauty brands discuss Asian issues, a missed opportunity for beauty brands to connect with these consumers.
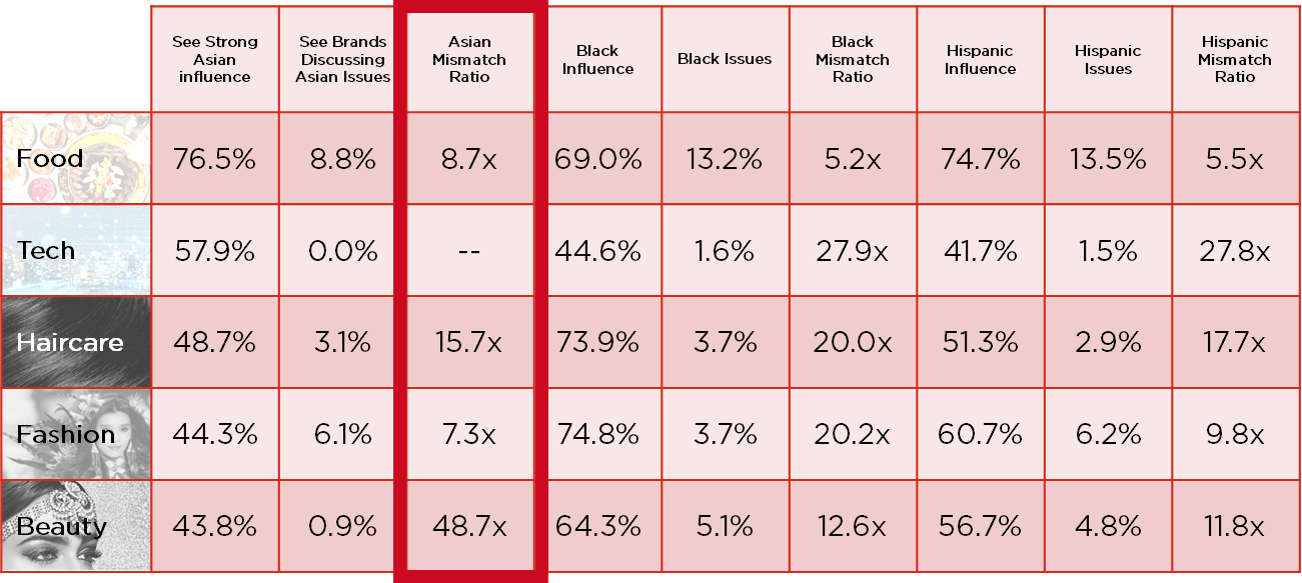
Above: Mismatched ratio of influence to brand representation. Source: 2019 MiM (Note: ‘Brands Discussing Asian Issues’ question not asked in 2020 MiM study)
J3ers speak out
Recently, two of our J3ers participated in Diversity & Belonging’s ‘Uniquely Me’ campaign, sharing their stories about why their heritage and culture is important to them. We could not be more proud of them, so we are amplifying their stories as we continue to lean into what makes UM (and J3!) BETTER.

Carolyn Shao, Planning Associate (Pharma)

Micah Reyes, Planning Manager (Pharma)
Extra credit reading
The biggest customer brands are missing out on the Asian American consumer (AdWeek)
Mr. President, you don't speak for Asian Americans (CNN)
Perpetual foreigners: Asian Americans in the American media (HuffPost)
In this time of xenophobic-driven fear, marketers need to uplift Asian American consumers (AdWeek)
What everyone can learn from the Indian beauty formula (HuffPost)
Asian Pacific American Media Coalition issues annual report cards grading TV networks on their diversity efforts (AAJC)
Netflix and the creation of the onscreen Hapa (Hapa Mag)